CSAT vs NPS vs CES: Which Customer Satisfaction Metric Should You Use?

Understand the difference between CSAT, NPS, and CES so you can pick the right metric, assign the right owner, and collect feedback that actually gets acted on.

Customer support team reviewing KPI dashboard with response time, satisfaction, resolution, and automation metrics for tracking support performance.

We’ve noticed a common theme across all the startups and SMBs we’ve served over the past decade.

Whenever the team is deciding on a customer service benchmark, they debate NPS vs. CSAT vs. CES. Inevitably, these teams land on "let's use all three." Six months later, the dashboards exist. Nobody knows what to do when they conflict.

Practically, these debates are not useful. CSAT, NPS, and CES aren't competing metrics. 

They're answering fundamentally different questions, on different timelines, for different parts of the business. 

  • The support manager who's accountable for NPS scores is being measured on something their team can't fully control. 
  • The team running CES surveys after every ticket close is collecting data that should inform process design, not training for customer service agents.

Picking the right metric isn't about philosophy; it’s about who can influence it with their day-to-day.

What each metric actually measures (And what it doesn't)

Each of these three surveys asks customers something distinct, and the difference in the question is the difference in what you learn.

CSAT vs NPS vs CES Comparison
Metric CSAT NPS CES
Survey question “How satisfied were you?” “How likely are you to recommend?” “How easy was it to get help?”
Scale 1–5 or 1–10 0–10 1–7
Scope Single interaction Entire relationship Single interaction
Timing Right after a touchpoint Periodic, such as quarterly or post-milestone Right after a touchpoint
What it can tell you Agent performance and interaction quality Overall brand loyalty and churn risk Process friction and workflow design
What it can’t tell you Whether the customer will stay What went wrong in support Whether the customer is satisfied

CSAT (Customer Satisfaction Score)

Infographic showing how to calculate CSAT score. The formula divides positive responses by total responses and multiplies by 100 to get the CSAT percentage. An example shows 80 positive responses divided by 100 total responses multiplied by 100 equals 80%. A scale from 1 to 5 shows that only scores of 4 and 5 are counted as positive responses.
How to Calculate CSAT Score

CSAT asks: "How satisfied were you with your experience today?" Customers rate on a 1–5 or 1–10 scale. 

It's a snapshot of how a specific interaction landed. It’s directly tied to a moment. CSAT scores are high-frequency and perishable. That volatility isn't a flaw. It's the signal.

NPS (Net Promoter Score)

Infographic showing how to calculate NPS score. A scale from 0 to 10 groups respondents into three categories: Detractors score 0 to 6 shown in red, Passives score 7 to 8 shown in grey, and Promoters score 9 to 10 shown in purple. The formula subtracts the percentage of Detractors from the percentage of Promoters to get the NPS. The score ranges from negative 100 to positive 100. A benchmark guide shows that a score below 0 is negative, 0 to 49 is good, and 50 and above is excellent.
How to Calculate NPS Score

NPS asks: "How likely are you to recommend us to a friend or colleague?" 

Customers score 0–10. Promoters (9–10), Passives (7–8), Detractors (0–6). NPS = % Promoters − % Detractors. 

It sounds simple, but what NPS actually captures is the cumulative weight of a customer's entire relationship with your brand.

It should be the north star for the entire company.

CES (Customer Effort Score)

Infographic showing how to calculate CES score. A scale from 1 to 7 groups responses into three categories: High Effort scores of 1 to 3 shown in red ranging from very difficult to difficult, Neutral score of 4 shown in grey labeled neither easy nor difficult, and Low Effort scores of 5 to 7 shown in purple ranging from easy to very easy. The formula divides responses of 5, 6, or 7 by total responses and multiplies by 100 to get the CES percentage. An example shows 60 easy ratings divided by 100 total multiplied by 100 equals 60%. Three icons on the right illustrate common CES triggers: resolved chat, repeat contact, and slow resolution.
How to Calculate CES Score

CES asks: "How easy was it to resolve your issue today?" Customers rate on a 1–7 scale. CES was developed by Gartner in 2010, and its core finding was counterintuitive: exceeding expectations doesn't build loyalty nearly as much as reducing effort does. 

Customers who had to work hard to get help are far more likely to churn, regardless of whether the issue eventually got resolved.

Now that we understand the difference between the metrics, let’s talk about who owns which metric. 

Who owns each metric?

Infographic showing who owns each customer satisfaction metric. CSAT is owned by Support Managers and Frontline Agents and operates at the interaction level. CES is owned by Operations and Process Design and operates at the workflow level. NPS is owned by CX Leadership and Product and operates at the company level. A warning note at the bottom states that holding support accountable for NPS is measuring the wrong thing.
Who Owns CSAT, CES and NPS

1. CSAT belongs to your support agents. 

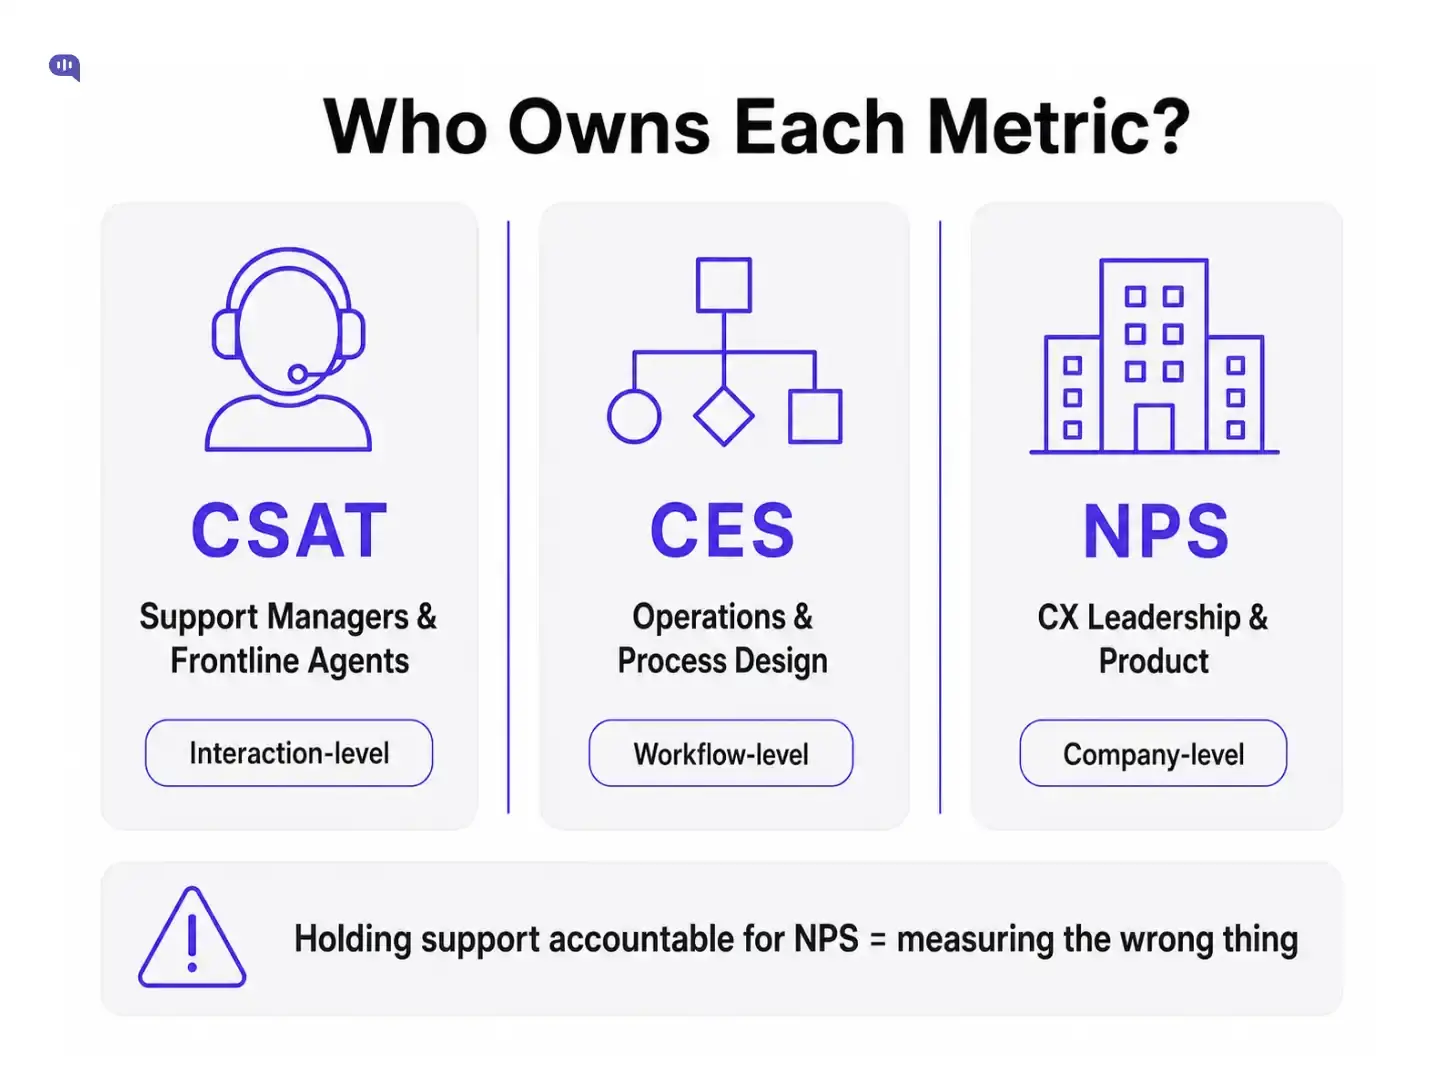
It's agent-attributed, interaction-level, and closable in a single conversation. When a CSAT score drops, a support manager can address it: review the transcript, coach the agent, and identify the pattern. This is the only metric in the trio where frontline ownership makes complete sense.

2. CES belongs to your operations and process design team. 

A high-effort score means the process failed the customer:

  1. They had to call back. 
  2. They were transferred twice. 
  3. The knowledge base didn't have the answer. 
  4. The form was confusing. 

Those are structural problems. Assigning CES accountability to agents is like measuring a surgeon's performance by the length of the hospital's check-in line.

3. NPS belongs to product, customer success, and CX leadership 

NPS reflects the sum of every experience a customer has had with your company. If NPS is low, it might be because support is slow, but it's equally likely to be due to pricing, a recent product regression, a poor onboarding experience, or a competitor eating your lunch.

Support can influence NPS. Support cannot own NPS. Holding a support team accountable for a score they have 30% control over is how you build a metric that everyone resents.

We've seen this play out consistently: the teams that get the most value from these metrics are the ones who've answered "who is empowered to act on this number?" before they start collecting it.

Coming to the collection, the survey triggers for each metric also influence its effectiveness. 

When to trigger the survey for CSAT vs. NPS vs. CES

Infographic showing when to trigger each customer satisfaction survey. A timeline illustrates that CSAT and CES should both be sent within minutes of an interaction closing, while NPS should be sent quarterly and never after a bad support contact. A warning note at the bottom highlights a common mistake: sending NPS immediately after a support interaction.
When to Trigger CSAT, CES and NPS Surveys

Timing is as important as the question itself. A well-timed survey gets honest data. A poorly timed one poisons the well.

CSAT and CES are transactional 

You should trigger them immediately after the interaction closes, while the experience is fresh. 

  1. For chat and email, automate the send within minutes of ticket resolution. 
  2. For phone support, follow up within the hour. 

Waiting 24 hours for transactional feedback is waiting too long; customers have moved on, and the rating becomes ambient sentiment, not interaction recall.

NPS is relational

It should never fire immediately after a support contact. Sending NPS right after a customer just waited 45 minutes on hold is asking them to rate the relationship at its lowest point. 

NPS cadences vary by business type:

  1. Quarterly for most SaaS products
  2. Post-renewal for B2B accounts
  3. 30–60 days post-onboarding for new customers. 

The goal is to catch customers in a neutral or positive state so the score reflects the relationship.

Now, let’s return to our starting question. If your team is debating about which metric to use, we’ve created a small tool that you can use to automate.

How to choose between CSAT, NPS, and CES: A manager's framework

We've built a Metric Chooser you can use below. You can answer three questions, and it tells you which metric to start with, who should own it, and what question to put in the survey.

Interactive Tool

Which Metric Should You Start With?

Answer 3 questions. Get a clear recommendation -- with the survey question to use and who should own it.

Question 1 of 3
01

What are you primarily trying to understand right now?

02

Who will be responsible for acting on the results?

03

Where are you in your feedback program?

Survey question to use
Who should own it
When to send it

If you want to map it manually, here's the logic:

  1. Start with CSAT if you want to evaluate agent performance, coach based on interaction quality, or identify which ticket types are generating dissatisfaction. CSAT gives you something you can act on at the team level within a week.
  2. Start with CES if you're seeing high repeat-contact rates, customers frequently escalating or calling back, or low adoption of your self-service tools. CES will tell you where the friction is in the journey. And that information should go straight to your operations or product team.
  3. Start with NPS if you have cross-functional alignment to act on the results, your leadership regularly reviews customer feedback, and you already have a baseline of CSAT data. NPS without those conditions is a number with no home.
  4. Don't start with NPS if your support team is still establishing baseline CSAT. You'll end up with a company health metric that nobody knows how to improve.

Once you’ve chosen the metric to start with, the question about whether you should measure all three metrics will come up. 

Can you use all three? 

Yes, but sequence matters, and size matters.

A five-person support team doesn't need an NPS program. 

They need CSAT scores and a weekly review of low-rated tickets. The overhead of running three concurrent survey programs, managing response rates, and synthesizing conflicting signals is real work. Don't create that infrastructure before you have the team to act on it.

The natural sequence for most support operations: 

  1. Start with CSAT at ticket close
  2. Once you have 90 days of data for CSAT, layer in CES for your highest-volume interactions 
  3. When you have cross-functional alignment, bring in NPS as a strategic overlay.

The teams that get all three right treat them as a system. 

  • CSAT and CES are operational - They fire constantly and feed into coaching, workflow design, and tooling decisions. 
  • NPS is strategic - It fires on a schedule and feeds into roadmap, pricing, and retention conversations. 

For example, low FCR (first contact resolution) will degrade your CES and CSAT scores long before NPS registers the impact. 

For a broader look at how these metrics align with operational KPIs such as first response time and average resolution time, see our guide to customer experience KPIs to track.

Conclusion

The "which metric is best?" debate misses the point. CSAT, NPS, and CES aren't competing: they're measuring different dimensions of customer experience on different timelines for different owners. The support manager who's accountable for NPS and the operations team, who are ignoring their CES data, are both measuring the wrong things for the wrong reasons.

Start with the metric that matches the question you're actually asking. Assign clear ownership before you collect a single response. And don't add complexity until you've built the habit of acting on simplicity. The right metric is the one that changes what you do on Monday morning.