Updated on December 9, 2024
As Peter Drucker famously said – “What gets measured, gets managed.”

Tracking the effectiveness of your customer service platforms, with the right metrics in place, can lead organizations to gain valuable insights and optimize their customer service strategy. This will ultimately lead to superior customer experiences.
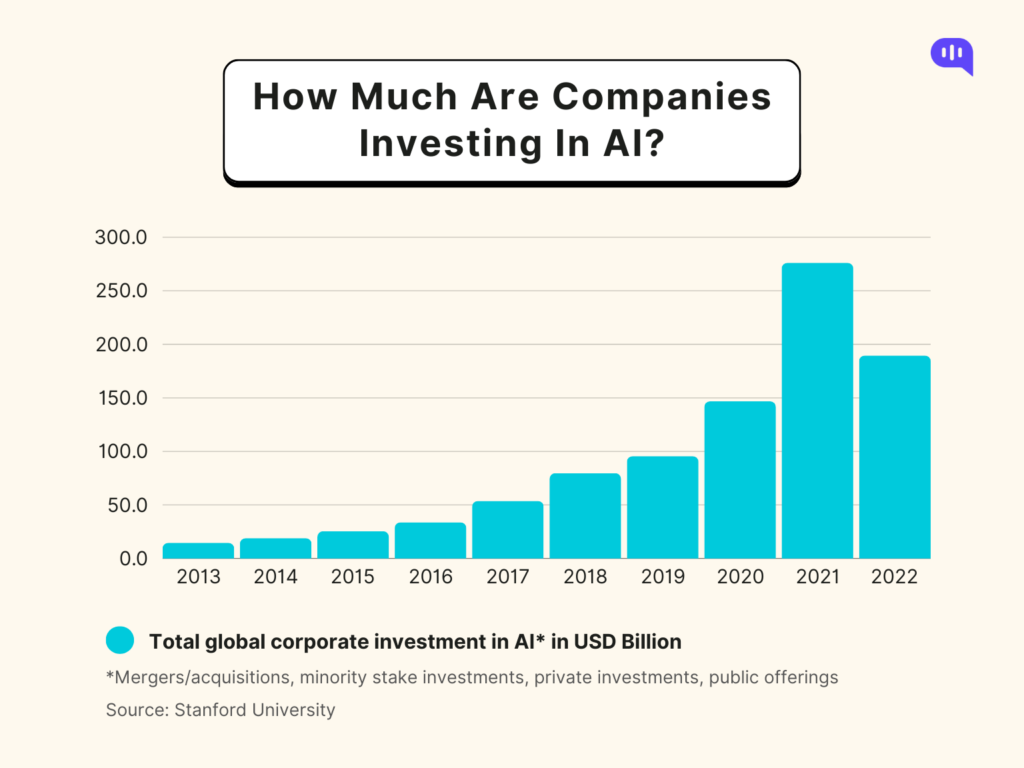
As more companies decide to invest in AI, we can expect customer service to evolve faster than ever before. AI in Customer service will be more efficient and lead to human beings solving more and more complex problems, making the lives of businesses and customers easier.
By monitoring and analyzing these 9 customer service metrics, companies can stay ahead in the competitive marketplace and build strong customer relationships. Here is a list of customer service metrics that companies must track in order to stay competitive:
- Customer Satisfaction Score (CSAT)
- First Response Time
- Average Resolution Time
- Intent Recognition Accuracy
- Conversation Handling Time
- Knowledge base effectiveness
- Interactions per Ticket
- Bot Utilization Rate
- Escalation Rate
Let us learn about the first metric on our list, the CSAT score
Customer Satisfaction Score (CSAT)
How do you know if a customer is satisfied with your company’s product or service? The answer is the Customer Satisfaction Score (CSAT), which is usually given in the form of a percentage.
A 100% CSAT score indicates that the customers are completely satisfied with your product or service, with a 0% CSAT indicating total customer dissatisfaction. CSAT is typically collected through post-interaction surveys where customers rate their experience on a scale ( Ex. 1 -10).
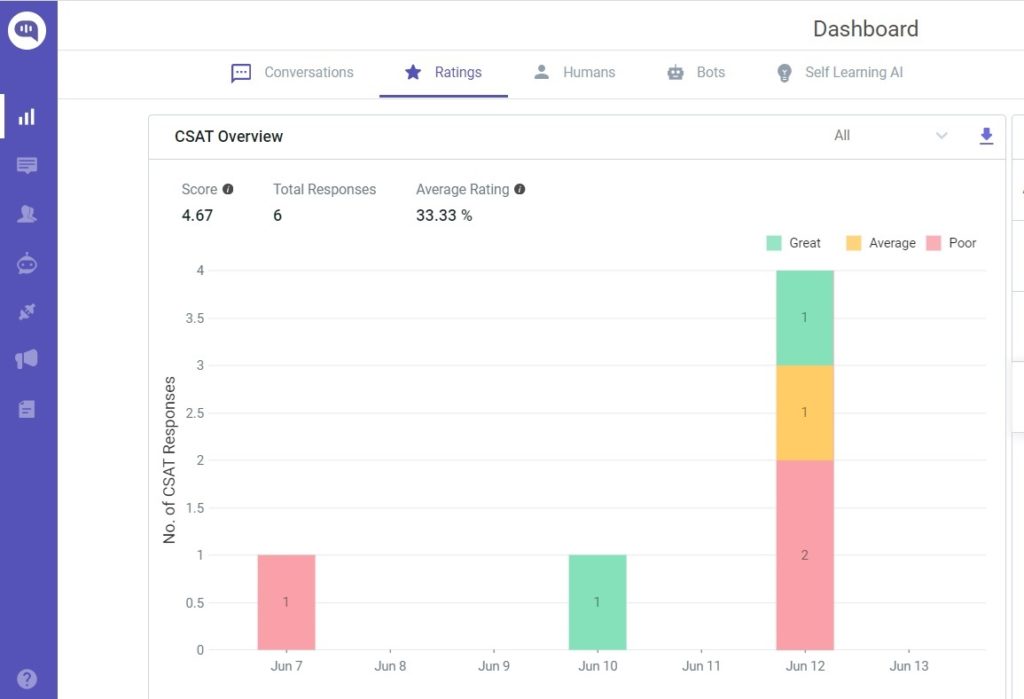
For a customer service platform, CSAT can represent how well the chatbot can understand and resolve queries, the relevance of its responses, and the overall interaction quality.
Regularly monitoring CSAT can help businesses identify trends, and help them make data-driven decisions that will enhance the AI’s performance. This will ultimately improve customer satisfaction.
First Response Time
The duration between a customer initiating a conversation and receiving the initial response from the customer service platform is called the First Response Time. These initial responses have to be prompt, as they indicate that the business actually cares about its customers.
These initial responses can be just acknowledgments, as they give a perception of service quality and reduce abandonment rates. FRT can be measured in real-time or over a specific period to identify trends or analyze areas of improvement.
Many organizations take First Response Time (FRT) seriously, including Slack, whose workplace chatbot aims for FRT under 5 seconds to keep the team’s communication efficient.
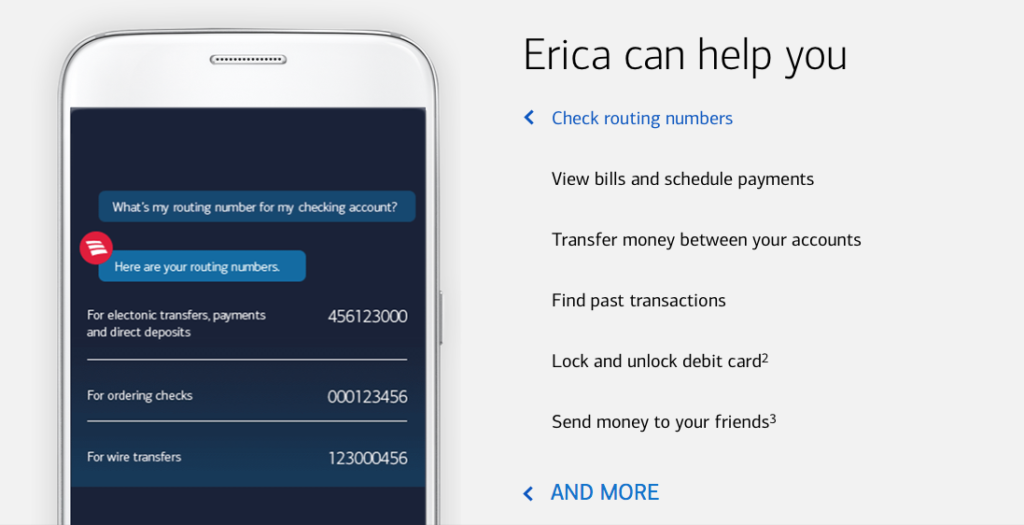
Bank of America is another organization that has adopted a chatbot called Erica, which has an FRT of just 2 seconds. This has significantly boosted the chatbot’s adoption rate.
Average Resolution Time
Average Resolution Time (ART) is the time taken for an organization to resolve its customer support tickets from start to finish. Lower ART = quicker resolution and higher customer satisfaction rates.
Conversely, higher ART indicates that there maybe complex underlying issues, such as knowledge gaps or unnecessary back-and-forth interactions that frustrate users.
This metric thus is a good reflection of the efficiency and effectiveness of the customer service platform in addressing customer concerns.
A lot of organizations take ART very seriously, and have implemented conversational Solutions such as chatbots to enhance operational efficiency.
One of them is Vodafone’s chatbot, TOBi, which is said to have reduced the ART by a whopping 47% when compared to human agents. It takes TOBi under 5 minutes to resolve basic queries.
Lower ART thus reduces customer effort and fosters satisfaction, which are the key drivers in an AI-powered service environment.
Intent Recognition Accuracy
Intent Recognition is the Customer Service platform’s ability to accurately understand the customer’s intent behind their query. High Intent Recognition Accuracy (IRA) means that the customer service platform is able to provide relevant responses, leading to efficient resolutions and positive user experiences.
On the other hand, if the IRA is low, it means that the platform is giving irrelevant answers, which will lead to frustrated customers and an increase in human agent escalations.
Typically, IRA is expressed as a percentage, with more and more organizations aiming for a 90% accuracy.
A real life example of an organization that is doing a phenomenal job with their IRA is the insurance company Lemonade, which reported a 96% IRA for its chatbot Jim. With Jim, the company was able to settle claims in seconds.
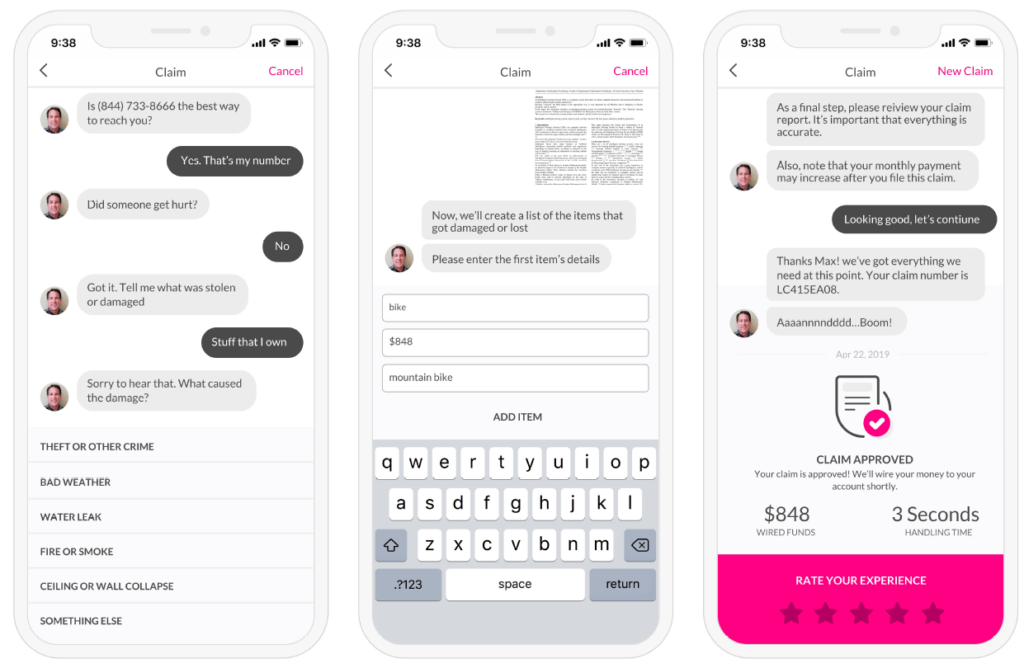
By giving preference to IRA, businesses can ensure that their customer service platforms can really understand what the customer needs, paving the way for efficient, satisfying interactions.
Conversation Handling Time
Conversation Handling Time (CHT), as the name indicates, is the average duration of interaction from the moment a customer initiates contact to the point where the issue is resolved. It provides valuable insights into the Customer service chatbot’s efficiency in the way it addresses customer needs, along with the overall quality of the UX.
Lower CHT means that the customer service platform can rapidly understand and resolve issues, which often leads to higher customer satisfaction and improved operational efficiency. With speedy resolutions, customers understand that the organization respects their time, positively impacting the perception of the brand.
CHT, however, must be carefully balanced with resolution quality. With excessively short resolution times, there is always the chance that the problem-solving has superficial responses or they don’t fully address the customer’s concerns.
KLM, the popular airline, has introduced an AI-powered chatbot called BlueBot, which improved the airline’s customer service by handling 50% of the conversations under 5 minutes.
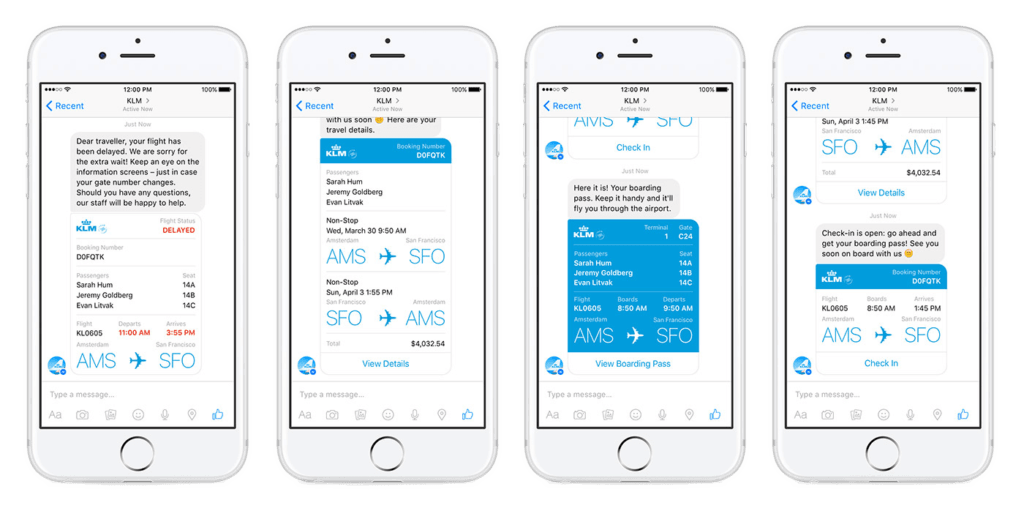
BlueBot with its ability to quickly assist with common queries such as flight information, booking changes, and FAQ, is a great example of how optimizing CHT can transform customer experience.
Knowledge Base Effectiveness
Knowledge Base Effectiveness (KBE) is a crucial metric for customer service platforms. It gives a measure of how effectively the customer service platform leverages the underlying information repository to provide relevant and accurate information.
There are several sub-metrics that you can use to measure KBE.
- Coverage: The percentage of customer queries that the platform can give an answer to using the knowledge base.
- Relevance: Checks if the responses directly addresses the customer’s specific question.
- Accuracy: How often is the information that is present correct and up-to-date.
- Usage: How frequently the different parts of the knowledge base are accessed, indicating potential redundancies.
Higher the KBE, greater is the resolution rate, with lesser handling times. This improves overall customer satisfaction.
Interactions per Ticket
Interactions per ticket is a measure of how many steps it takes to solve a customer’s problem. This customer service metric helps understand how complex a customer issue actually is and how much conversation is needed to address it.
These interactions can be in the form of multiple touch points, and all of them contribute to interactions for one ticket. For example, if a customer reaches out to your business over chat, is then redirected to an IVRS number, and finally a human agent solves the issue, all these interactions count for that one ticket.
A low IPT indicates that the customer service platform can resolve queries faster, leading to higher customer satisfaction. It should, however, be noted that a very low IPT indicates over simplistic answers, which will frustrate customers.
Conversely, a higher LPT indicates that the platform is struggling to understand what the customer is trying to say or provide relevant responses, leaving a trail of frustrated customers.
A good real-life example of a chatbot that uses low IPT is Spotify’s chatbot. This chatbot aims to keep IPT under 4 for common issues such as password resets or playback problems, ensuring swift resolutions.
Bot Utilization Rate
Bot Utilization Rate is a measure of the percentage of customer service enquiries that are handled by the chatbot vs. those which requires a human intervention. This metric is a good measure of the overall adoption of the customer service platform.
High BUR = successful automation, reducing the workload on human agents and often leading to cost savings and faster response times. This will ultimately lead to cost savings.
High utilization, however, must not come at the expense of resolution quality, and customer satisfaction.
TelOne, owned by the government of Zimbabwe, had over 90% of the customers interact directly with the Kommunicate chatbot, showcasing a high Bot Utilization Rate.

By concentrating on BUR, businesses can gauge their platform’s impact on service operations, ensuring a balance between automation and human touch..
Escalation Rate
Escalation rate measures the number of inquiries that a customer service platform, such as a chatbot, cannot handle independently and must transfer to a human agent. It is a crucial metric that helps identify the limitations of the AI system.
A low ER means that the chatbot is able to handle a wide range of customer queries independently, reducing the burden on human agents. This often leads to faster resolutions and cost savings.
However, a high ER means that there are some gaps in the chatbot’s knowledge or intent recognition issues. It may also indicate that the customer’s problems are more complex than anticipated, meaning there is scope for knowledge base improvement.
For example, Autodesk’s virtual agent initially had a high ER of 55%, but, after continuous improvements, reduced it to 25%, significantly enhancing the operational efficiency.
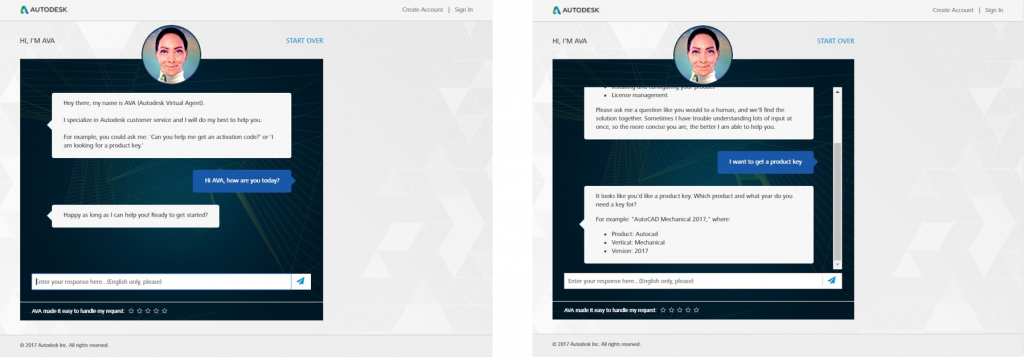
Minimizing ER will lead to customer service platforms handling more diverse inquiries, improving customer satisfaction, and balancing automation and human touch.
Wrapping up
By measuring these valuable metrics that we have mentioned above, from response times to resolution rates to knowledge base effectiveness – businesses can turn data into actionable insights. The goal is to create a system where AI efficiency meets human sympathy. The chatbots will continue to evolve, and so must our benchmarks. Regular metric analysis thus is not just a checklist item; it is a commitment to continuous improvement.

As a seasoned technologist, Adarsh brings over 14+ years of experience in software development, artificial intelligence, and machine learning to his role. His expertise in building scalable and robust tech solutions has been instrumental in the company’s growth and success.

