Updated on November 17, 2025
In today’s fast-paced digital world, delivering exceptional customer service is more than just solving problems – it’s about creating seamless, meaningful interactions. With the growing integration of AI in customer support, professionals need to stay updated with both traditional and emerging terminology. From understanding key metrics like First Response Time (FRT) and Customer Satisfaction (CSAT) to embracing new AI-driven concepts such as AI Resolution Rate and Chatbot Containment Rate, mastering these terms is crucial for improving support efficiency.
In this article, we’ll walk through both foundational customer service terminology and cutting-edge AI concepts shaping the future of customer support. Whether you’re a seasoned service leader or a product manager working on AI-driven tools, this guide will ensure you’re up to speed with the language driving today’s customer service innovations.
AI Resolution Rate
AI resolution rate measures how effectively an AI system, such as a chatbot or virtual assistant, resolves customer queries without human intervention. It’s an important metric for evaluating the efficiency of AI-driven customer service, indicating how many issues are fully handled by AI compared to those that need human support. A higher AI resolution rate reflects better automation and customer satisfaction.
AI Deflection Rate
AI deflection rate measures the percentage of customer queries that are diverted away from human agents and successfully resolved by AI-powered systems, like chatbots or virtual assistants. A high AI deflection rate indicates that the AI is effectively reducing the need for human intervention by handling common customer issues on its own, improving efficiency and reducing support costs.
Supercharge your support team with AI-driven email ticketing – automate, organize, and resolve queries effortlessly!Average Problem Resolution Time
The average problem resolution time is the average time taken by an agent to resolve customer queries. Primarily, it can be a good performance evaluation metric for the service agent. This metric can also be calculated team-wise; giving a holistic view of overall team performance.
Average Response Time
Average response time is the average time taken by an agent to reply to a customer. Note that, it is a collective average of time taken to reply to any customer message, not just the first one.
There is no defined standard of average response time as it depends on your support hours and medium of support. Ideally the lesser the better.
Agent
The Agent is the one who provides support to the customers by answering their questions about products or services. He acts as the voice of the company.
Agent Reply Template
It is the standard pre-written template used by some companies to reduce first response time. These templates usually contains answers to the general questions such as refund or replacements. It also contains standard greeting or signatures which can be used while replying to customers.
Business Hours
It is the time in which the company support team is available to its customers for answering their questions related to product/services. Now, most of the customers 24/7 support but it depends on the businesses to set standard time based on their operations.
All the service metrics such as First response time, Resolution time is calculated in line with the business hours.
Chatbot Containment Rate
Chatbot containment rate measures how effectively an AI system, such as a chatbot or virtual assistant, resolves customer queries without human intervention. It’s an important metric for evaluating the efficiency of AI-driven customer service, indicating how many issues are fully handled by AI compared to those that need human support. A higher AI resolution rate reflects better automation and customer satisfaction. Read more on how to improve your chatbot containment rate, here.
Customer Experience
The overall experience a customer had during his entire lifecycle as a customer. Customer experience helps you generate a holistic view of your product and support activities, as the overall customer experience is driven by the customer’s view about your product and support both.
Customer Self Service
Self-service is the channel through which customers find answers to their queries themselves through various resources you provide. These resources could be your blog posts, developer documentation, frequently asked questions, and knowledge-base articles.
It is a great way to reduce the number of generic and repetitive customer queries.
Customer Retention
Customer retention is the process where companies do different activities or efforts such as loyalty programmes to keep existing customers with them. This also helps to reduce customer churn.
Customer Feedback
It is the opinion of the customer about a particular product/service or their experience in interacting with a company. This helps companies in many ways such as building roadmap or adjusting their customer experience to fulfill the needs of the customer.
CSAT Scores (Customer Satisfaction Score)
CSAT is the measure of the happiness or satisfaction a customer has with the support and services you have provided. Collecting CSAT surveys is widely accepted as a standard practice throughout the support industry. You can learn more about CSAT and CUSAT(Customer Unsatisfaction Scores) here.
Customer Satisfaction Survey
These surveys consist of different questions and asked customers through different channels such as Online, Telephonic, or face to face. Sometimes customers or asked to rate a product or service on a scale of 1-5. These answers are further analyzed by companies to improve their product /service.
Customer Churn
It is the survey conducted by companies to know if the customers are satisfied or not with their product or service.
It is the number of customers who leaves your company or the number of customers who unsubscribe or a number of customers who discontinue using your product /service and stop paying you in a particular time frame.
Customer Expectations
It is the assumption of customers about your product /service/organization. This generally occurs with their previous experience or the information they have received from others about your product /service.
CRM(Customer Relationship Management)
It is a framework used by companies to build a longlasting relationship with its customers. Usually companies CRM software to execute this process effectively.
Closed Tickets
Number queries solved at a particular time.
Canned Response
These are the responses that are used to reply to the repeated questions. Here keywords are used to save long-form answers. Once you type a keyword, answers will appear in the typing area and can be edited before sending it to customers.
Some of the Customer Support Software will have this feature and helps to save support agent time.
Community Forum
Its online platform built by companies to increase digital customer engagement. Here customers are encouraged to join the forum. This forum can be used for different purposes such as
Customer Feedback: Customers can post feedback about products /services.
Product Ideas: If customers have any ideas related to product features, the product road map can be shared and get validation or progress from the forum owners.
Question and answer: Customers can post any question related to a particular product and community people can answer this question based on their knowledge.
Announcement: This forum can be used to announce new features, Bug fixes by the owners
Contact Center
It is a department in an organization where all the support channel is handled such as Phone, Email, Social media, and Faxes.
Customer Management Institute (ICMI) defines a contact center as an integrated system of processes, people, strategies, and technologies. It provides access to information, resources, and expertise, through appropriate channels of communication, enabling interactions that create value for the customer and organization.
Call Center
Call a center is a physical place that provides services like inbound and outbound call support to businesses. This will have their own support agent teams who act as a support agent for different industries.
Customer Advocacy
It is a customer-centric service provided by the company to improve the experience of the customer. This is basically used to create a loyal customer and a hidden marketing strategy.
Customer Service Philosophy
It is a strategy developed by the customer service department to handle support /service in such a way that is in line with its Company vision, Brand message, and Brand Value.
Customer Loyalty
It is a reward system designed by companies to appreciate their loyal customers. Here companies give coupons, reward points, free merchandise like custom clothing to their frequent purchasing customers.
The main aim of this program is to retain more customers.
Customer Lifetime Value (CLTV)
“The total amount of revenue can be generated in the future through a particular customer based on their present cash flow”.
CLTV Formula:
(Order Value on average) x (Number of recurring Sales) x (Estimated retention time)
Customer Life Cycle
It is the different stages customers go through while considering to purchase a product, service, or solution. Customer loyalty and retention adds to this but in the post-purchase stage.
Customer Care
It is a process of taking care of customers from the starting stage to the end of the customer life cycle. This is more related to customer experience and touchpoints.
Customer Journey Mapping
It is the process where the company get into customer shoes and understand their pain points to create a tailored customer experience.
Customer Engagement
It is effective communication and interaction between the company and customers about products/services offered. Check these simple customer engagement techniques.
Downtime
It is the time when your service/product is unavailable to the customers due to a technical issue or maintenance.
First Contact Resolution (FCR) Ratio
FCR is the measure of how many tickets/queries were resolved during the first contact made by the customer, without the need for additional messages or followups. A good FCR is the mark of an efficient support team. A 75% FCR is a good indication of the customer support team’s efficiency.
First Response Time
First Response Time also known as First Reply Time is the time elapsed between submission of a query by a customer and the first time a customer support agent replies to that query. It generally depends on the support mediums your organization has. Generally, large organizations put a detailed guide about their response time in their service level terms.
Frequently Asked Questions (FAQ)
Faq is a collection of most common and generic questions and their answers. These FAQs could be about your business, products or services. FAQs help in customer self-service by reducing generic queries.
Learn more about how the new age FAQs should be done here.
Gamification
It is the program used by companies to motivate their customer support team. This makes support team job more competitive and fun. In this process, companies create a reward system in their support software.
Here customer support agents have rewarded points for a quicker response or receiving a rating from the customer for providing good support. There are also negative points for poor performance.
Interactive Voice Response(IVR)
When someone calls customer care, it gives them an option to choose the service/assistance they want and it will be automatically connected to the related department. This is called as IVR.
Knowledge Base
The knowledgebase is the storage of information regarding product /service. It consists of self-help docs with detailed instruction about usage or installation of product/service.
This can be accessed by customers or agents to get an answer to different questions related to product/service. Usually, the information stored in knowledgebase is created by the subject matter experts.
Live Chat
It is a tool which helps businesses to provide 24/7 customer support to their customers.
Multichannel Support
Providing customer support through different channels such as Phone, Email, Messages, Live chat, Social Media.
Net Promoter Score (NPS)
NPS is closely related to customer experience. It is the measure of how likely your customers are to tell others about your products or services. The customers who are happy with your product and have had great customer support experience are more likely to recommend your products/services to others.
Usually collecting NPS requires the help of a marketing team as well. You can learn more about how marketing and support teams can effectively collaborate here.
Proactive Support
Often treated as a part of customer success, proactive support is the strategy to take control of premeditated problems that might become real customer issues later. You can do this by numerous means such as sending in-app campaigns or creating a checklist of processes involved inefficient use of your products and services
New Tickets
The number of new customer queries received at a particular time frame.
Queuing Resolution Time
Queuing resolution time is the average hold time of customers until they are served.
This could be the time elapsed in providing the first response or time elapsed between routing customers from one department to the other. The agenda is to keep this time as low as possible. But again, it depends on your support medium and the ratio of the number of queries you get vs the number of agents you have.
Service Level Agreement(SLA)
SLA is a formal or informal agreement between the service provider and the client. It specifies what the client will receive from a service provider.
Self Service Ratio
It is the ratio of customers who were able to solve their queries without contacting your support team.
Touchpoints
It is the number of times a customer comes in contact with your company from start to finish point. Touchpoints could be the customer see your ad in online/physical banners or they contact your customer service.
Trouble Shooting
It is the process of finding a root cause of a particular issue.
Unassigned Ticket
Usually received tickets will be automatically assigned or manually assigned to an agent. If the ticket is not assigned to anybody then it will be considered as an unassigned ticket.
How would you use these metrics?
Usually, you would look at using these numbers and associated comparisons to:
- Improve and optimize your processes and performance for better support and happier customers
- Build reports for your weekly, monthly, quarterly or yearly stand-ups or meetings
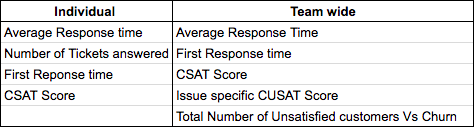
Process and Performance Optimization
Optimization can be either team-wide or for individual team members. A crude list for each is mentioned below:
Reporting
Each of these customer service metrics, specifically team metrics, will be asked and used in your weekly, monthly or yearly reports.
Though the problem is not the metrics itself, it’s how you use it.
Your reports should drive action and promote vertical thinking.
Consider correlations, CUSAT vs Churn, Average response time vs CUSAT. These help you drive change, what would happen if you could decrease the average response time?
Would it increase CSAT score or lower CUSAT?
Look at the trends, does average response time lower over time or is it increasing?
Compare this with your correlation to find possible reasons.
Ultimately, metrics can only show you if something works or not? It’s up to you to correlate actions to outcomes and build a system that works for you.

Devashish Mamgain is the CEO & Co-Founder of Kommunicate, with 15+ years of experience in building exceptional AI and chat-based products. He believes the future is human and bot working together and complementing each other.

")