Updated on August 9, 2026
Summarize this blog post with: ChatGPT | Perplexity | Claude | Grok
If you run CX at a carrier, this was probably the year your dashboards finally cooperated. Satisfaction scores rose and complaint volumes fell, without either number changing what you spend replacing subscribers who left anyway. This guide explains why those measures came apart from retention, and what to track instead.
Key takeaways
- US telecom satisfaction reached record highs in 2026, which tells you the industry improved on what satisfaction surveys ask about, not that subscribers became more likely to stay.
- Customer Effort Score predicts loyalty more reliably than satisfaction measures or Net Promoter Score, a finding established in the original CES research and never seriously overturned.
- Complaint rates identify which provider has a problem, but they understate its scale by orders of magnitude, because only subscribers persistent enough to escalate ever get counted.
- Repeat contact for one unresolved issue is the strongest churn signal a carrier can collect from existing data.
- Retention friction now carries direct financial exposure, following a £28 million UK penalty in July 2026, the largest Ofcom has issued under its consumer protection rules.

What is customer experience in telecom?
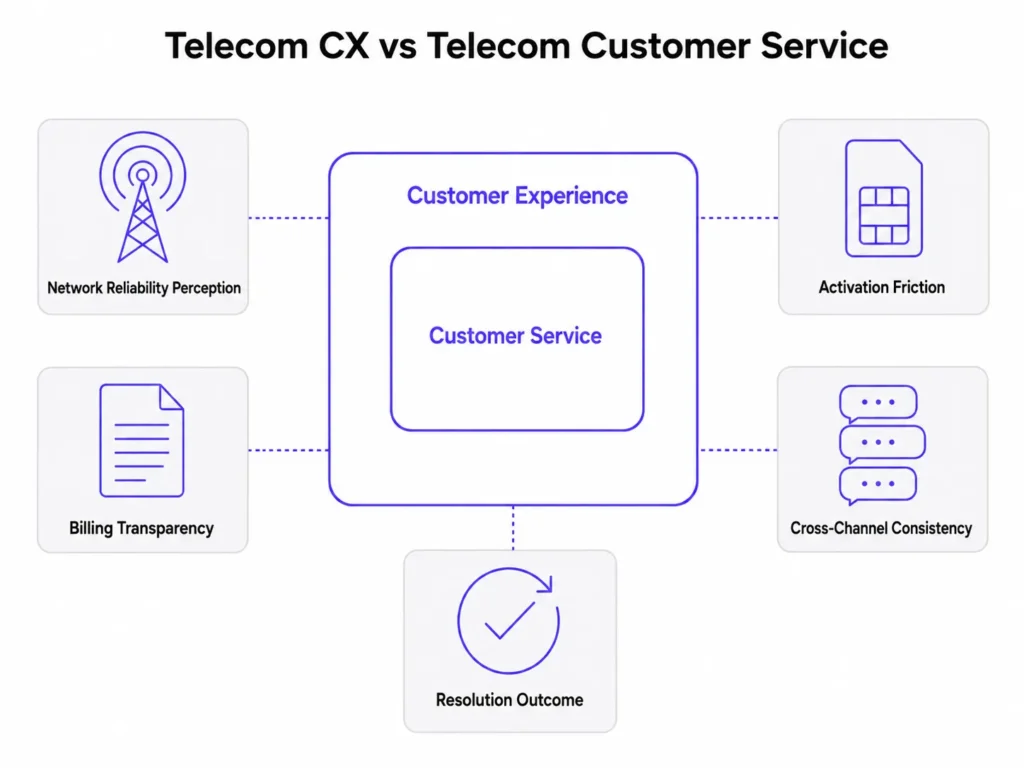
Customer experience in telecom is the cumulative record of every interaction a subscriber has with their provider across the full relationship, spanning acquisition, activation, billing, support, and eventual renewal or churn. Telecom customer service is a component of it, covering the support interaction alone.
That separation matters operationally, since the two are usually owned by different teams and measured against different targets. A subscriber can have a technically excellent support call and still leave six weeks later because their bill changed without warning, or because activation took four days.
Five components carry most of the weight in a carrier context:
- Network reliability perception, which is not the same as measured uptime
- Billing transparency, meaning whether charges are predictable rather than merely accurate
- Activation friction, covering SIM provisioning, eSIM setup, and the gap between what was sold and what arrived
- Cross-channel consistency across app, voice, messaging, and web
- Resolution outcome, meaning whether the problem was fixed rather than whether the ticket was closed
Why did telecom satisfaction scores stop predicting churn?
Satisfaction scores stopped predicting churn because satisfaction and effort are separate constructs, and only one of them governs whether a subscriber stays.
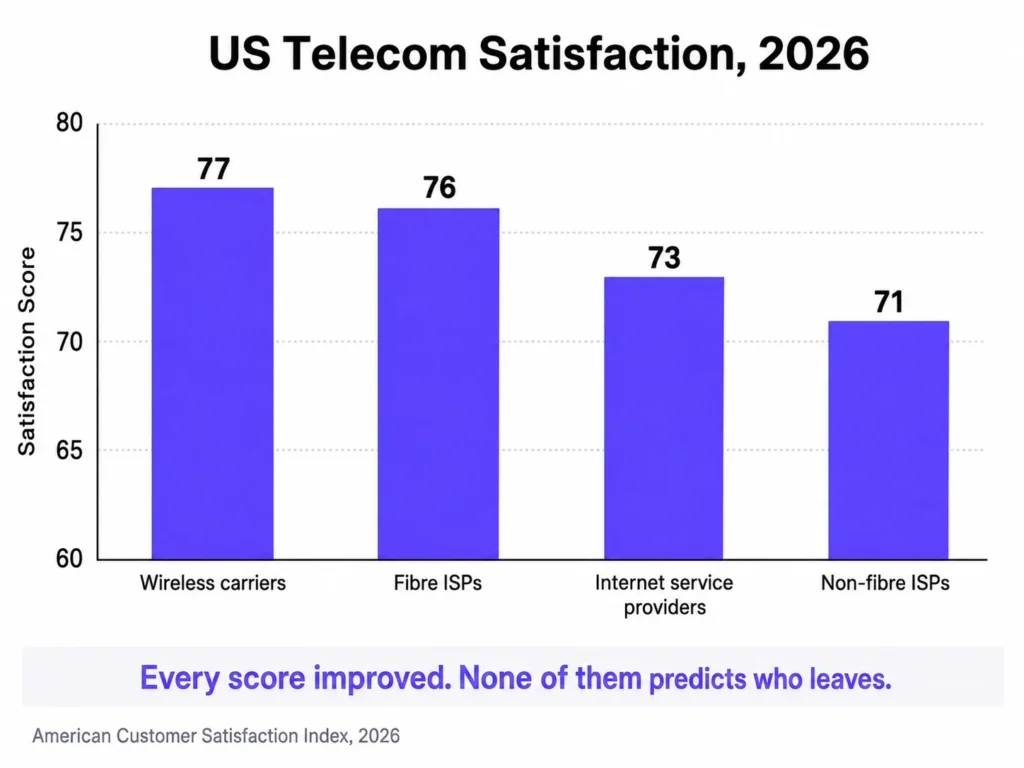
The ACSI Telecommunications, Cell Phone, and Smartwatch Study 2026 put US wireless service provider satisfaction at 77, a record high for the sector, up 3% year on year. Internet service providers reached 73, with fibre at 76 and non-fibre at 71. The study drew on 26,963 completed surveys collected between April 2025 and March 2026. Source: American Customer Satisfaction Index, 2026.
Those gains are real, and every measured customer experience benchmark improved. The question is what a rising satisfaction score entitles a carrier to conclude about retention, and the answer from the underlying research is very little. Work behind The Effortless Experience found that roughly one in five satisfied customers still intended to defect to a competitor. Source: Dixon, Toman and DeLisi, 2013.
What the Virgin Media penalty exposed
The clearest recent demonstration comes from the UK, where the regulator publishes both complaint data and enforcement decisions. In July 2026, Ofcom fined Virgin Media £28 million over cancellation practices between January 2022 and September 2024. It is the largest penalty Ofcom has issued under its consumer protection rules. Source: Ofcom, 2026.
The investigation found a two-tier retention structure in which only second-tier agents could process a cancellation. Ofcom estimated that more than one million callers were forced to repeat their request to at least one further agent before their cancellation could proceed, and concluded that the commission scheme financially rewarded agents for the behaviour.
Ofcom’s published complaint data did identify Virgin Media during this period. In the third quarter of 2023 the provider drew 32 broadband complaints per 100,000 customers against an industry average of 15, the worst in the market, with complaints handling accounting for 43% of them against an industry average of 32%. Source: Ofcom, 2024. The provider was visibly worst in class, and the reason was visibly complaints handling.
What the data could not convey was magnitude. Even at roughly double the industry average, 32 complaints per 100,000 reads as a service quality problem to be managed rather than a structural barrier affecting millions of calls. Ofcom received 1,881 complaints about difficulty cancelling across the whole period, of which its analysis later attributed at least 649 to the two-tier process specifically.
That distance between a rate expressed per 100,000 and a conduct finding expressed in millions of calls is the practical issue for any carrier reading its own dashboards. Complaint rates rank providers against each other. They do not size the underlying behaviour.
| Metric | What it reliably shows | What it cannot show |
| ACSI satisfaction score | Industry-level direction of travel | Whether a specific subscriber will renew |
| Regulatory complaint rate | Which provider is worst, and on what | Scale, or who left instead of escalating |
| Internal CSAT | Sentiment on tickets you closed | Whether the customer agrees it is resolved |
| First-contact resolution | Speed of ticket closure | Repeat contact filed under a new ticket ID |
Which metric actually predicts telecom churn?
Customer Effort Score predicts loyalty better than satisfaction measures or Net Promoter Score, and that conclusion comes from the research that produced the metric.
Matthew Dixon, Karen Freeman and Nicholas Toman of the Corporate Executive Board, now part of Gartner, surveyed more than 75,000 customers about service interactions and published the results in Harvard Business Review in July 2010 under the title “Stop Trying to Delight Your Customers.” They found that 96% of customers who had a high-effort service experience went on to behave disloyally, against 9% of those who had a low-effort one. Source: Harvard Business Review, 2010.
Applied to a carrier: a subscriber who spends 45 minutes across three calls resolving a billing dispute is a higher churn risk than one paying five pounds more per month who never has to call. Net Promoter Score will rate the two of them similarly.
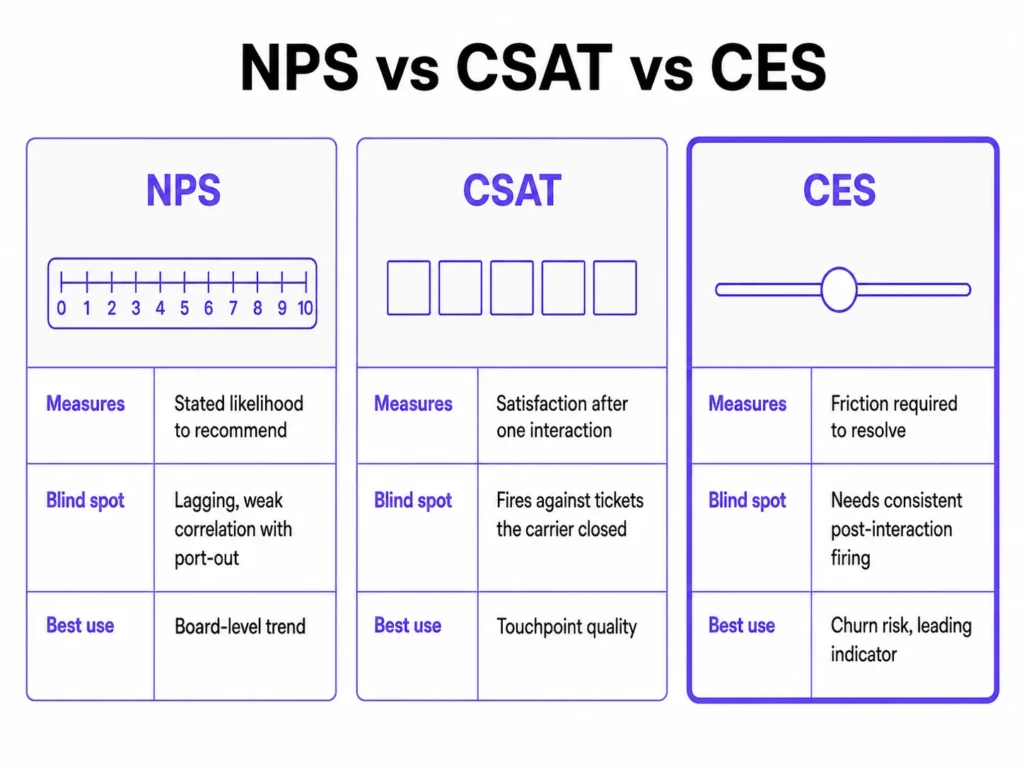
| Metric | Measures | Blind spot in telecom | Best use |
| NPS | Stated likelihood to recommend | Lagging, weak correlation with port-out | Board-level trend |
| CSAT | Satisfaction after one interaction | Fires against tickets the carrier closed | Touchpoint quality |
| CES | Friction required to resolve | Needs consistent post-interaction firing | Churn risk, leading indicator |
Most carriers still report NPS to the board. The evidence has favoured effort for more than fifteen years. For a fuller breakdown of when each measure earns its place in a reporting stack, see our guide to CSAT vs NPS vs CES.
Where does telecom support actually break down?
Telecom support breaks down at five points, each of which drives telecom customer churn without appearing clearly in standard reporting.
| Failure point | How it drives churn | Where the fix sits |
| Retention friction | Effort at the exit turns a departing subscriber into a regulatory complaint | Process and incentive design |
| Agent context blindness | Forces repetition, which reads as indifference | Data layer |
| Deflection without resolution | Moves the contact to a costlier channel with frustration attached | Automation design |
| Siloed complaint ownership | Produces contradictory answers and repeat contact | Ownership model |
| SLA theatre | Hides real failure points from root-cause analysis | Measurement definition |
Retention friction
Retention friction is any process that makes leaving harder than joining. Virgin Media’s penalty was reduced by 30% only because the company admitted the failings and agreed to settle, so carriers running tiered cancellation queues or paying save-rate commissions should treat that structure as a live liability rather than a retention tactic.
Agent context blindness
Most agents open an interaction without the subscriber’s full history, which turns every follow-up into a fresh explanation. The cause is architectural rather than behavioural. Until billing, CRM, network and support records resolve to one identity, better scripts will not fix it, and preserving context on escalation remains impossible by definition. Carriers without a defined tiering model will get more from a ticket escalation process framework than from additional agent training.
Deflection without resolution
Automation deployed to cut agent volume rather than to resolve issues produces the worst available outcome. When the flow hits its limit and the handoff to a human drops the transcript, the subscriber restarts on a third channel carrying two failed attempts with them. A direct phone call would have been cheaper.
Siloed complaint ownership
One billing dispute may require network operations, billing and account management to agree on an answer. With no named owner the case circulates, the subscriber collects contradictory responses, and the SLA clock gets used to close the ticket rather than confirm the fix. Automating billing dispute resolution at first contact removes the handoff chain that creates this.
SLA theatre
Marking a case resolved on internal closure inflates first-contact resolution and keeps SLA compliance clean while corrupting CSAT, which then surveys against a ticket the customer does not consider closed. The damage compounds, because root-cause analysis subsequently runs on data pointing at the wrong failures. Choosing which customer support KPIs carry reporting weight is the control that prevents it.
How do you improve customer experience in telecom?
Improving telecom CX starts at the data layer, because unified customer identity is a precondition for every other change rather than an optimisation of it.
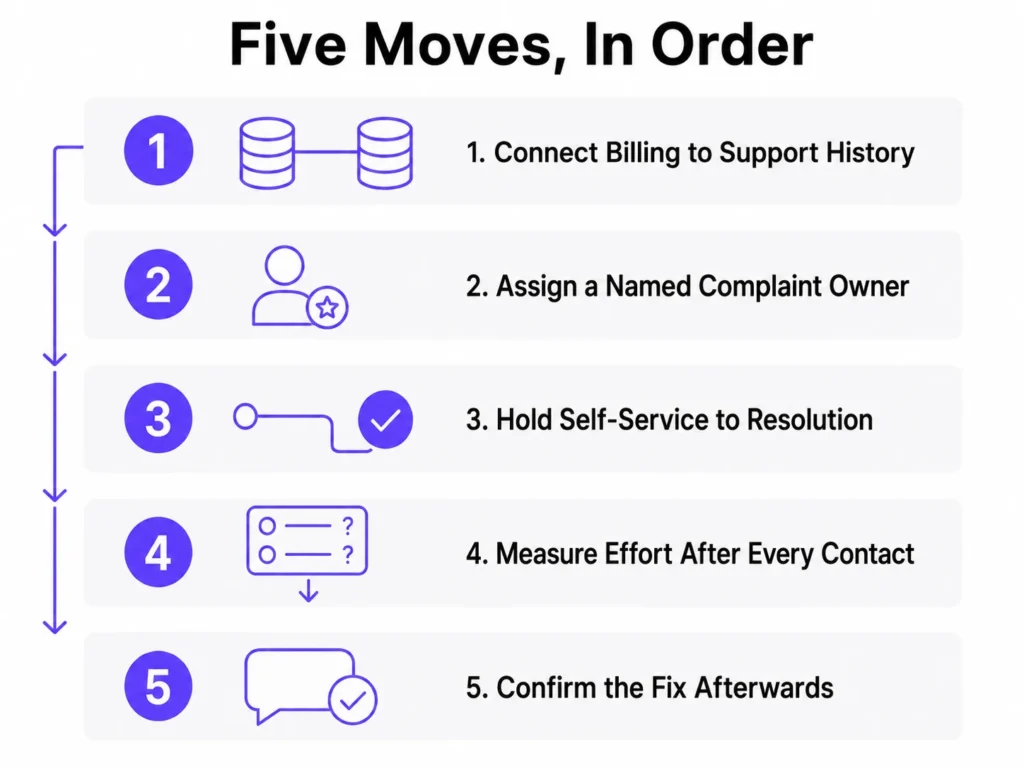
Fix one connection first. A full systems integration programme is not the practical starting point. Identify the single link that would most reduce repeat contact, usually between billing history and support history, and build that one.
Assign a named owner to every complaint. One person accountable for outcome, measured on customer-confirmed resolution. Proactive outreach during network incidents converts a complaint moment into a care moment and cuts inbound volume in the same window.
Hold self-service to a resolution standard. The test is binary. Either the flow resolves the query with context preserved on handoff, or it does not ship. Carriers evaluating AI customer service in telecom should compare resolution rate rather than deflection rate. When TelOne deployed AI agents on its front-line queues, the result was a 25% reduction in support workload, achieved by resolving repeat queries rather than routing them.
Measure effort after every interaction. Fire a two-question CES survey within 24 hours of closure on every channel. Ask how easy resolution was, and whether the issue is actually fixed. Route anything below three out of five to a retention specialist inside 48 hours. The second question is what catches SLA theatre.
Confirm the fix afterwards. Most carriers never follow up, which leaves the subscriber’s final memory of the interaction as the frustration that opened it. One outbound confirmation costs almost nothing and replaces that memory.
Where does AI actually help telecom CX?
AI helps where the underlying process already works and scales the failure where it does not. Automation layered onto siloed ownership produces faster, more consistent versions of the same breakdown.
Four applications carry most of the measurable value in a carrier environment:
- Predictive churn scoring, using support history, billing events and device tenure to flag at-risk subscribers before the port-out request
- Agent assist, surfacing account history and next-best action mid-call so agents stop navigating legacy systems
- Proactive incident notification, converting inbound complaints into outbound care contacts during outage windows
- Plan and usage matching, where AI plan recommendations reduce bill shock by moving subscribers onto tariffs that fit actual consumption
Channel choice matters as much as model choice. Moving retention conversations off voice queues onto WhatsApp automation removes the hold time that generates most effort complaints, since asynchronous threads preserve context by default. For carriers still routing everything through voice, IVR deflection with voice AI is usually the faster first move. Kommunicate’s telecom AI agents are built for carriers running both.
What to do next
Measure effort on one channel for 30 days before changing anything else. Fire the two-question survey after every closure, then compare results against your existing CSAT for the same interactions. The gap between them is your SLA theatre estimate, and it is usually wider than expected.
Then pull repeat-contact rate by issue type. Whatever tops that list is where your churn originates, whatever your satisfaction scores report.
Conclusion
US telecom satisfaction scores are the highest they have been, and one of the largest consumer protection penalties in UK regulatory history landed in the same year. Carriers optimised directly for the measures they report. Effort is the one nobody optimised for, which is why it still predicts churn.
Frequently asked questions
What is CX in telecom?
CX in telecom is the cumulative experience a subscriber has with their provider across the whole relationship, covering acquisition, activation, billing, support and renewal. Telecom customer service sits inside it and refers only to the support interaction.
How do you improve customer experience in telecom?
Begin at the data layer by unifying billing, CRM and support history so agents and automation work from one customer record. Then assign named ownership to every complaint, hold self-service to a resolution standard rather than a deflection target, and measure Customer Effort Score after every interaction.
How do you improve customer service in telecommunication?
Reduce the number of contacts needed to resolve one issue. Repeat contact is the strongest churn signal available from existing data, so resolving more issues at first contact usually beats reducing average handle time.
What are the 5 C’s of customer experience?
There is no single authoritative 5 C’s framework for customer experience, and versions in circulation vary by author. The most widely used 5 C’s model in marketing refers to Company, Customers, Competitors, Collaborators and Climate, which is a strategic analysis tool rather than a CX framework.
Why is customer experience important in telecom?
Because service interactions destroy loyalty more often than they build it, so each avoidable contact is a retention risk rather than a neutral cost. Regulatory exposure has also risen, as the 2026 Virgin Media penalty showed that retention friction now carries direct financial consequence.

Devashish Mamgain is the CEO & Co-Founder of Kommunicate, with 15+ years of experience in building exceptional AI and chat-based products. He believes the future is human and bot working together and complementing each other.

Aditi is an MBA candidate at IIM Bodhgaya, specializing in Marketing and Strategy. As a dedicated marketer, she brings practical experience in market research, data analytics, and B2B execution to her work. Her expertise in refining product positioning and driving go-to-market strategies consistently supports insight-driven business growth.